
Florian Nicolas
Engineer
Datadog Anomaly Detection for AWS Resources

When we think about monitoring, we cannot think about another thing than threshold-based monitors. Let’s imagine that you are monitoring hosts than encounter lots of variations in the concerned metrics. The threshold set on the first deployment rings everytime the limit is reached while the hosts might not be meeting any threat but uses more resources than last week. That’s where anomaly-based monitor could be useful!
Anomaly detection
An anomaly monitor is a feature allowing you to supervise metrics another way. This type of monitor uses an algorithmic feature made to identify the metric’s behavior considered unusual compared to the past, taking trends, seasonal day-of-week, and time-of-day patterns into account. Monitoring memory use for instance would be a very good monitor using an anomaly approach.
An anomaly detection algorithm reviews metrics to detect suspicious occurrences that look different than the other patterns of behaviors. In Datadog, algorithms are set during the creation of the monitors.
In overall, anomaly detection leans on machine learning to work efficiently. And every solution providers add their cherry on the top of the cake, adding their native features. In this article, we’ll focus more on Datadog.
Composite monitors
In case you’d like to make monitors with a more complex layer of conditions, you can also make some composites.
Composite monitors are monitors based on two existing monitors with a custom condition in order to notify the user on time or not. It can be considered as a group of two monitors.
Mostly, composites rely on anomaly with a threshold monitor.
Integrating Datadog Anomaly monitoring with AWS
In this chapter, we will cover the steps you need to follow in order to make your brand new anomaly detection monitor work.
Defining the metrics
If you’re currently using Datadog, the first step might be useless because we assume that you’ve already done it in the past. Obviously, if you haven’t created metric, you can’t do anything.
Metrics are numerical values meant to track elements of your environment during time. As said before, the metrics could be memory information, CPU utilization, number of pods rebooting on an EKS environment and much more.
Metrics are essential in order to make Datadog do its job, monitor hosts in a cloud infrastructure. Datadog agents installed on your hosts sends metric data directly to your Datadog platform but many other metrics can be added by integrations.
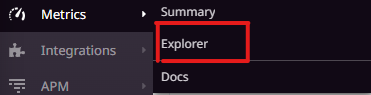
In order to see what monitors are available in your infrastructure, click on the explorer button in the metrics menu:
 |
|---|
| *Figure 1 - Explorer Menu |
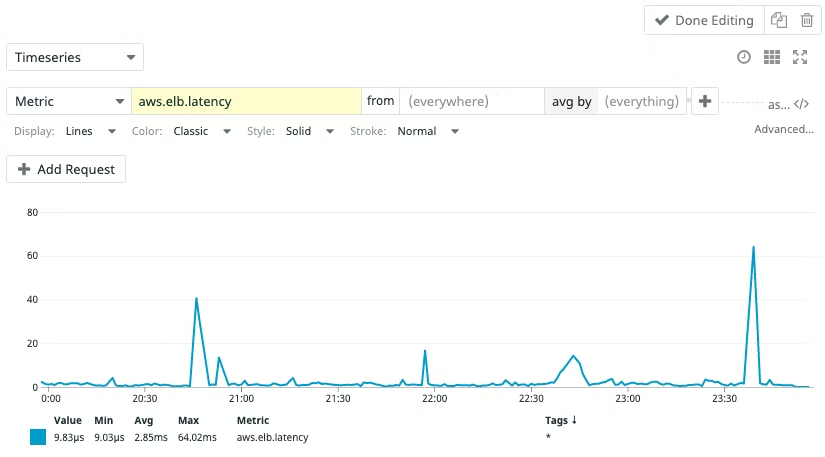
You can then see and query metrics in order to manipulate data and see what you’d like, here’s an example of what we can see with Datadog.
 |
|---|
| *Figure 2 - Explorer View |
Showing a metric as shown above is meant to have an overview about the data fetched by the metric in case we’d like to see whether a problem occurs or not. Even if it is interesting we might want to automate the process of seeing if there is an abnormal variation of the data fetched by the metrics and be alerted about it. You’ll see how to create and deploy an anomaly below.
Creating an anomaly monitor
In our approach, we are just going to extract the wanted monitor to take the configuration we want before integrating it to our Terraform script. We will have a look on how we are going to set it up and then how to export it.
 |
|---|
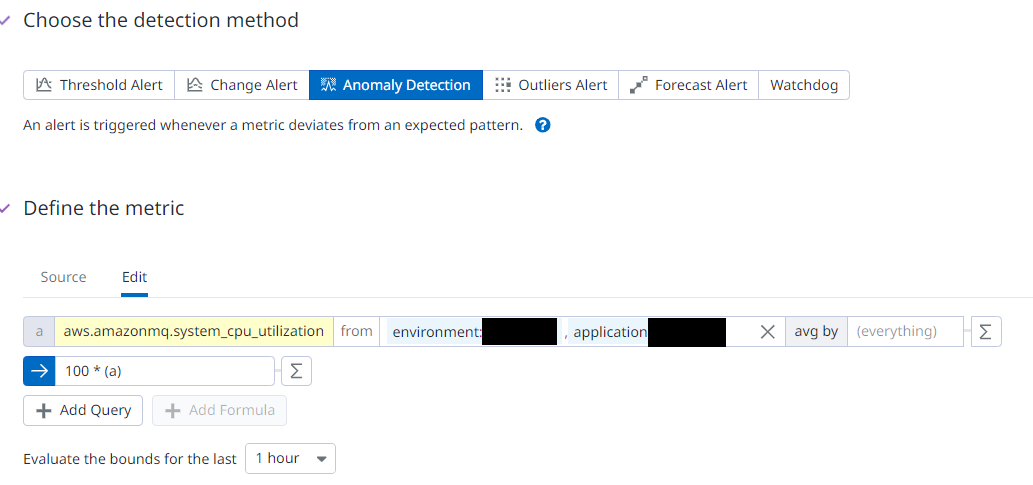
| *Figure 3 - Metric View |
Here we choose to introduce you with an anomaly set to monitor the CPU performance variations on rabbitmq in some of our environments and in a specific application.
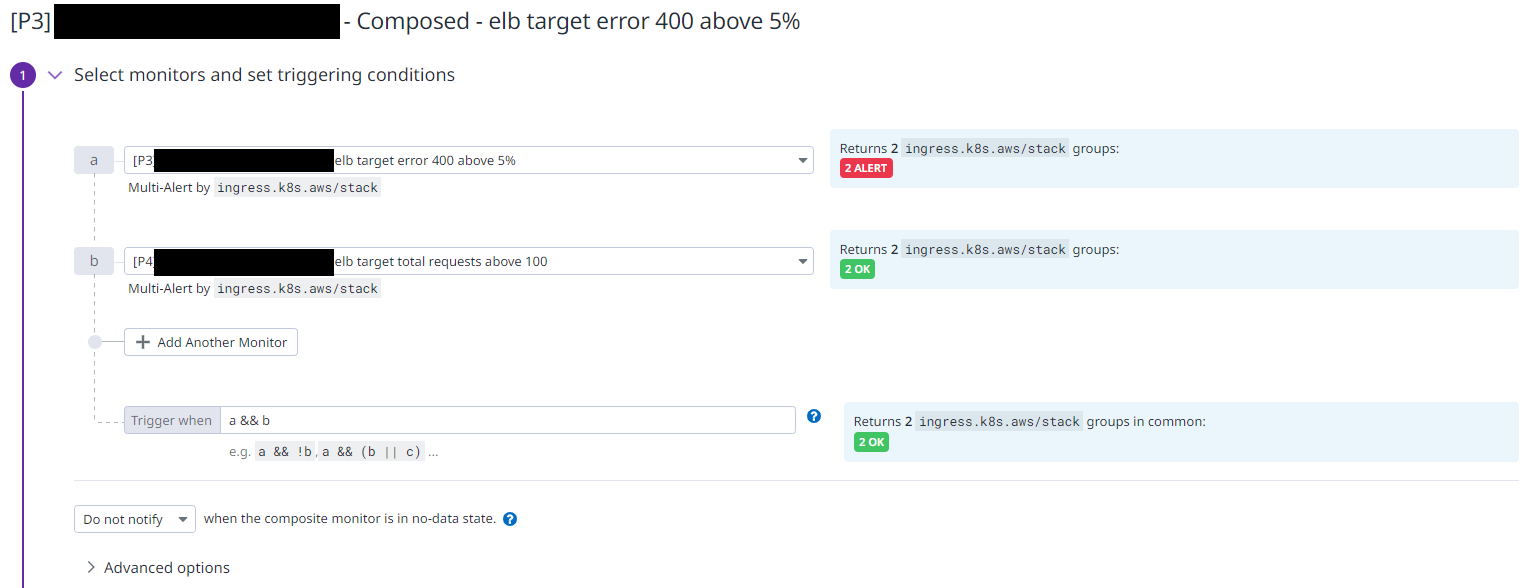
Here’s a example of how we implement a composed monitor.
 |
|---|
| *Figure 4 - Composite View |
You can see that we have to set a trigger referring to an “and” or a “or” to set up the time when the monitor has to be triggered.
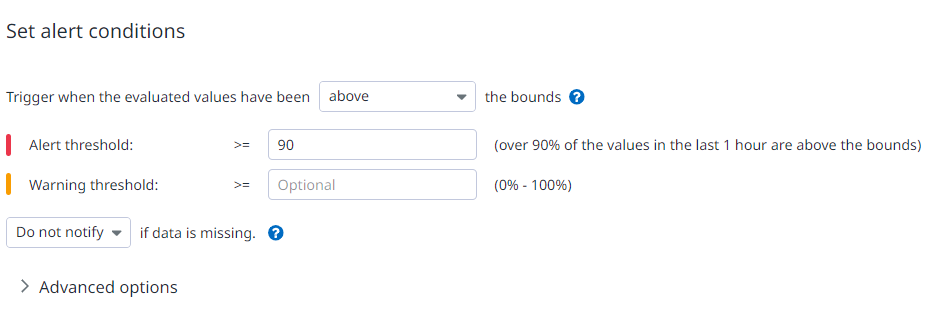
Set alert conditions
We’ll find two options that will allow us to set up condition as to when the monitor will notify us. The argument is a percentage. In this example, we set the alert threshold so it will alert us when 90% of the metric value is above the threshold by notifying the team. Note that we haven’t made any warning to not overwhelm the team with alerts. We can also set up the monitor to notify us when it encounters “no data”. We choose not to do that for this monitor for the sake of simplicity.
 |
|---|
| *Figure 5 - Alert Condition |
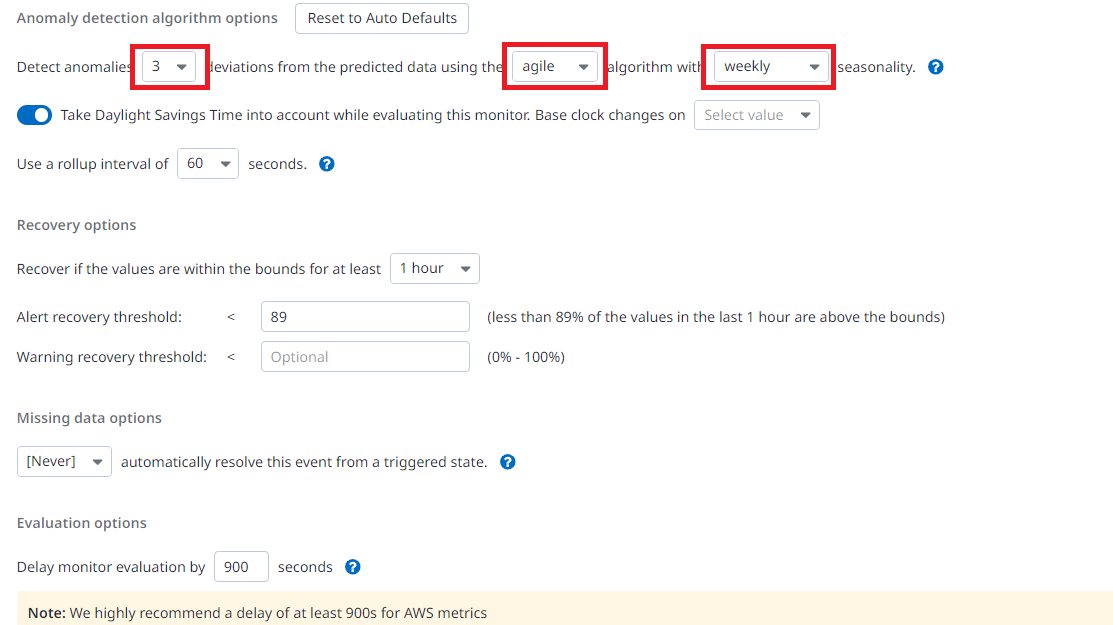
Adding advanced options
Here are the most important factors to set up correctly to make your monitor as precise as you want. The more deviations you choose, the more precise it gets.
 |
|---|
| *Figure 6 - Advance Option |
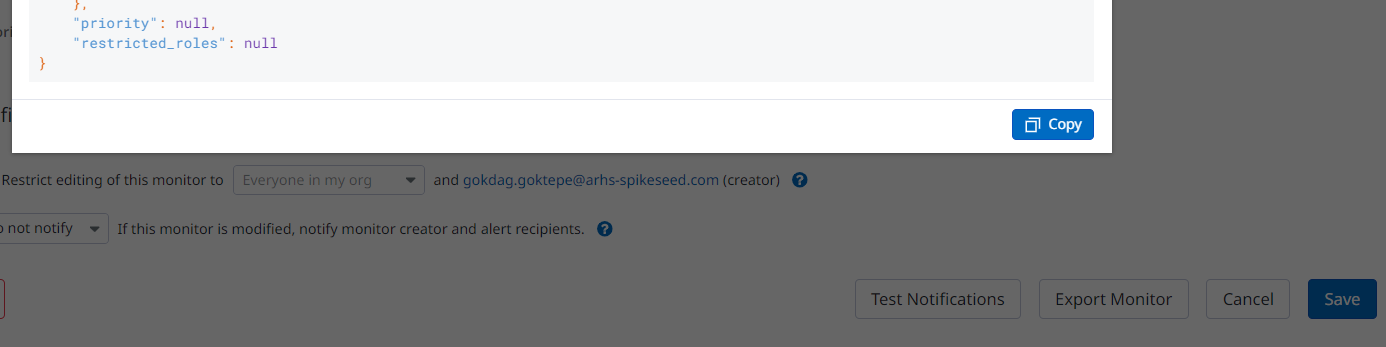
Exporting the configuration
The option below is not mandatory, actually it’s an interesting approach if you are not familiar with the syntax of the Datadog’s Terraform provider. You just have to replace the JSON syntax by the HCL one that looks quite similar. You might need to have a look at the documentation about the provider still, but the queries won’t have to be written from scratch.
At the bottom of the page, you’ll find the export button, that’s how we are going to export all the monitors we want to implement. Click on it and then copy-paste the elements that has to be written wherever it’s needed.
 |
|---|
| *Figure 6 - Export Button |
Using Terraform to deploy new monitors
In ARHS we use Terraform to push our configurations to Datadog. It makes it totally automated and allows us to have a checking on each changes in comparison to the last update of the configuration with Terraform.
General Terraform script
Here’s a template of an average script we use to deploy our new monitor. The variables are meant to not mean anything. Here is an example:
1
2
3
4
5
6
7
8
9
10
11
12
13
14
15
16
17
18
19
20
21
22
23
24
25
26
27
28
resource "datadog_monitor" "example_anomaly" {
	name = "example"
	type = "query alert"

	message = <<-EOF
	    Alert message here
	  EOF

	query = <<-EOF
	      <Paste the query here>
	    EOF

	require_full_window = false
	notify_no_data      = false
	no_data_timeframe   = 120
	new_group_delay     = var.anomaly.host_delay
	priority            = var.anomaly.priority_tag
	tags                = ["tag policy here"]

	monitor_thresholds {
	critical= each.value.anomaly_threshold
	critical_recovery= each.value.critical_recovery
	}
	monitor_threshold_windows {
		recovery_window = "last_${var.anomaly.windows_timeframe}h"
		trigger_window  = "last_${var.anomaly.windows_timeframe}h"
	}
}
Composite Terraform script
And that’s how we do with a composite monitor.
1
2
3
4
5
6
7
8
9
10
11
12
13
14
15
16
17
18
19
20
21
22
resource "datadog_monitor" "alb_compose_400" {
  name = "[P${each.value.priority}] ${each.value.account} - ${each.value.region} - Composed - example ${each.value.threshold}%"
  type = "composite"

  message = <<-EOF
    Example
  EOF

  query = <<-EOF
    ${datadog_monitor.example[each.key].id} && ${datadog_monitor.alb_target_total_requests["${each.value.account}-${each.value.region}-p4"].id}
  EOF

  monitor_thresholds {
    critical = each.value.threshold
  }

  require_full_window = false
  notify_no_data      = false
  no_data_timeframe   = 120
  priority            = each.value.priority
  tags                = ["P${each.value.priority}", var.project, "${each.value.account}", "region:${each.value.region}", "environment:${var.aws_accounts[each.value.account].env}"]
}
Applying changes
Terraform deployment are easy, first we plan our changes to compare to the current infrastructure and Terraform will show the changes as an output once the process is done. Then we can apply the changes.
1
2
3
4
5
#first we verify the changes:
terraform plan

#once the changes fits with our expectation, launch this:
terraform apply
Use Case
Anomaly detection and composite monitoring is used within ARHS mainly in order to:
- Prevent alert fatigue so MSP engineers can detect real problems.
- Make better decisions on what is working or not in our system.
- Partially forecast future problems so then we can take preventive actions.
Globally these monitoring techniques allows us to ensure reliability of our services and as our MSP team solves the potential problems as soon as possible, we make it sure for our customer that all the issues met in their infrastructure are taken and fixed as soon as possible in case an alert gets out of the anomaly range or the composite’s expectation.
However anomaly monitoring might not be the best thing to rely on in some cases. The monitoring techniques have to be decided during the monitoring strategy as well as while the project is running to make improvements on the algorithms set.
Here are some cases where anomaly monitoring might not be the best choice:
- When dealing with highly volatile and/or unpredictable data patterns. As the anomalies adapt themselves according to the data patterns given by a metric, the anomalies would not be able to guess the accuracy of the event.
- Stable and predictable environment. If monitoring a data storage, a threshold would fit quite well.
In the meantime composite monitors has to be used in case you’d like to combine monitoring techniques to get a more precise alerting. For instance, you can monitor the storage by combining an anomaly to see the variations on the input and adding a threshold to set the storage limit. That way you can have an accurate alerting on the storage. However if you just want to monitor one of the two, composite is not the right choice.
Conclusion
This article focuses on anomaly detection which can help you solve some of your monitoring problems. You should be aware of the possibilities of both anomaly detection and composite detection, knowing how to distinguish them and have an overview of how they can be implemented manually or by using Terraform.